
The system you grow your brand with.
A tracker you talk to, not a report you wait for.
Everything you expect from a brand tracker, turned into an always-on assistant for your brand's data. Ask it what changed, understand why, and see what to do next, exactly when you need to decide.
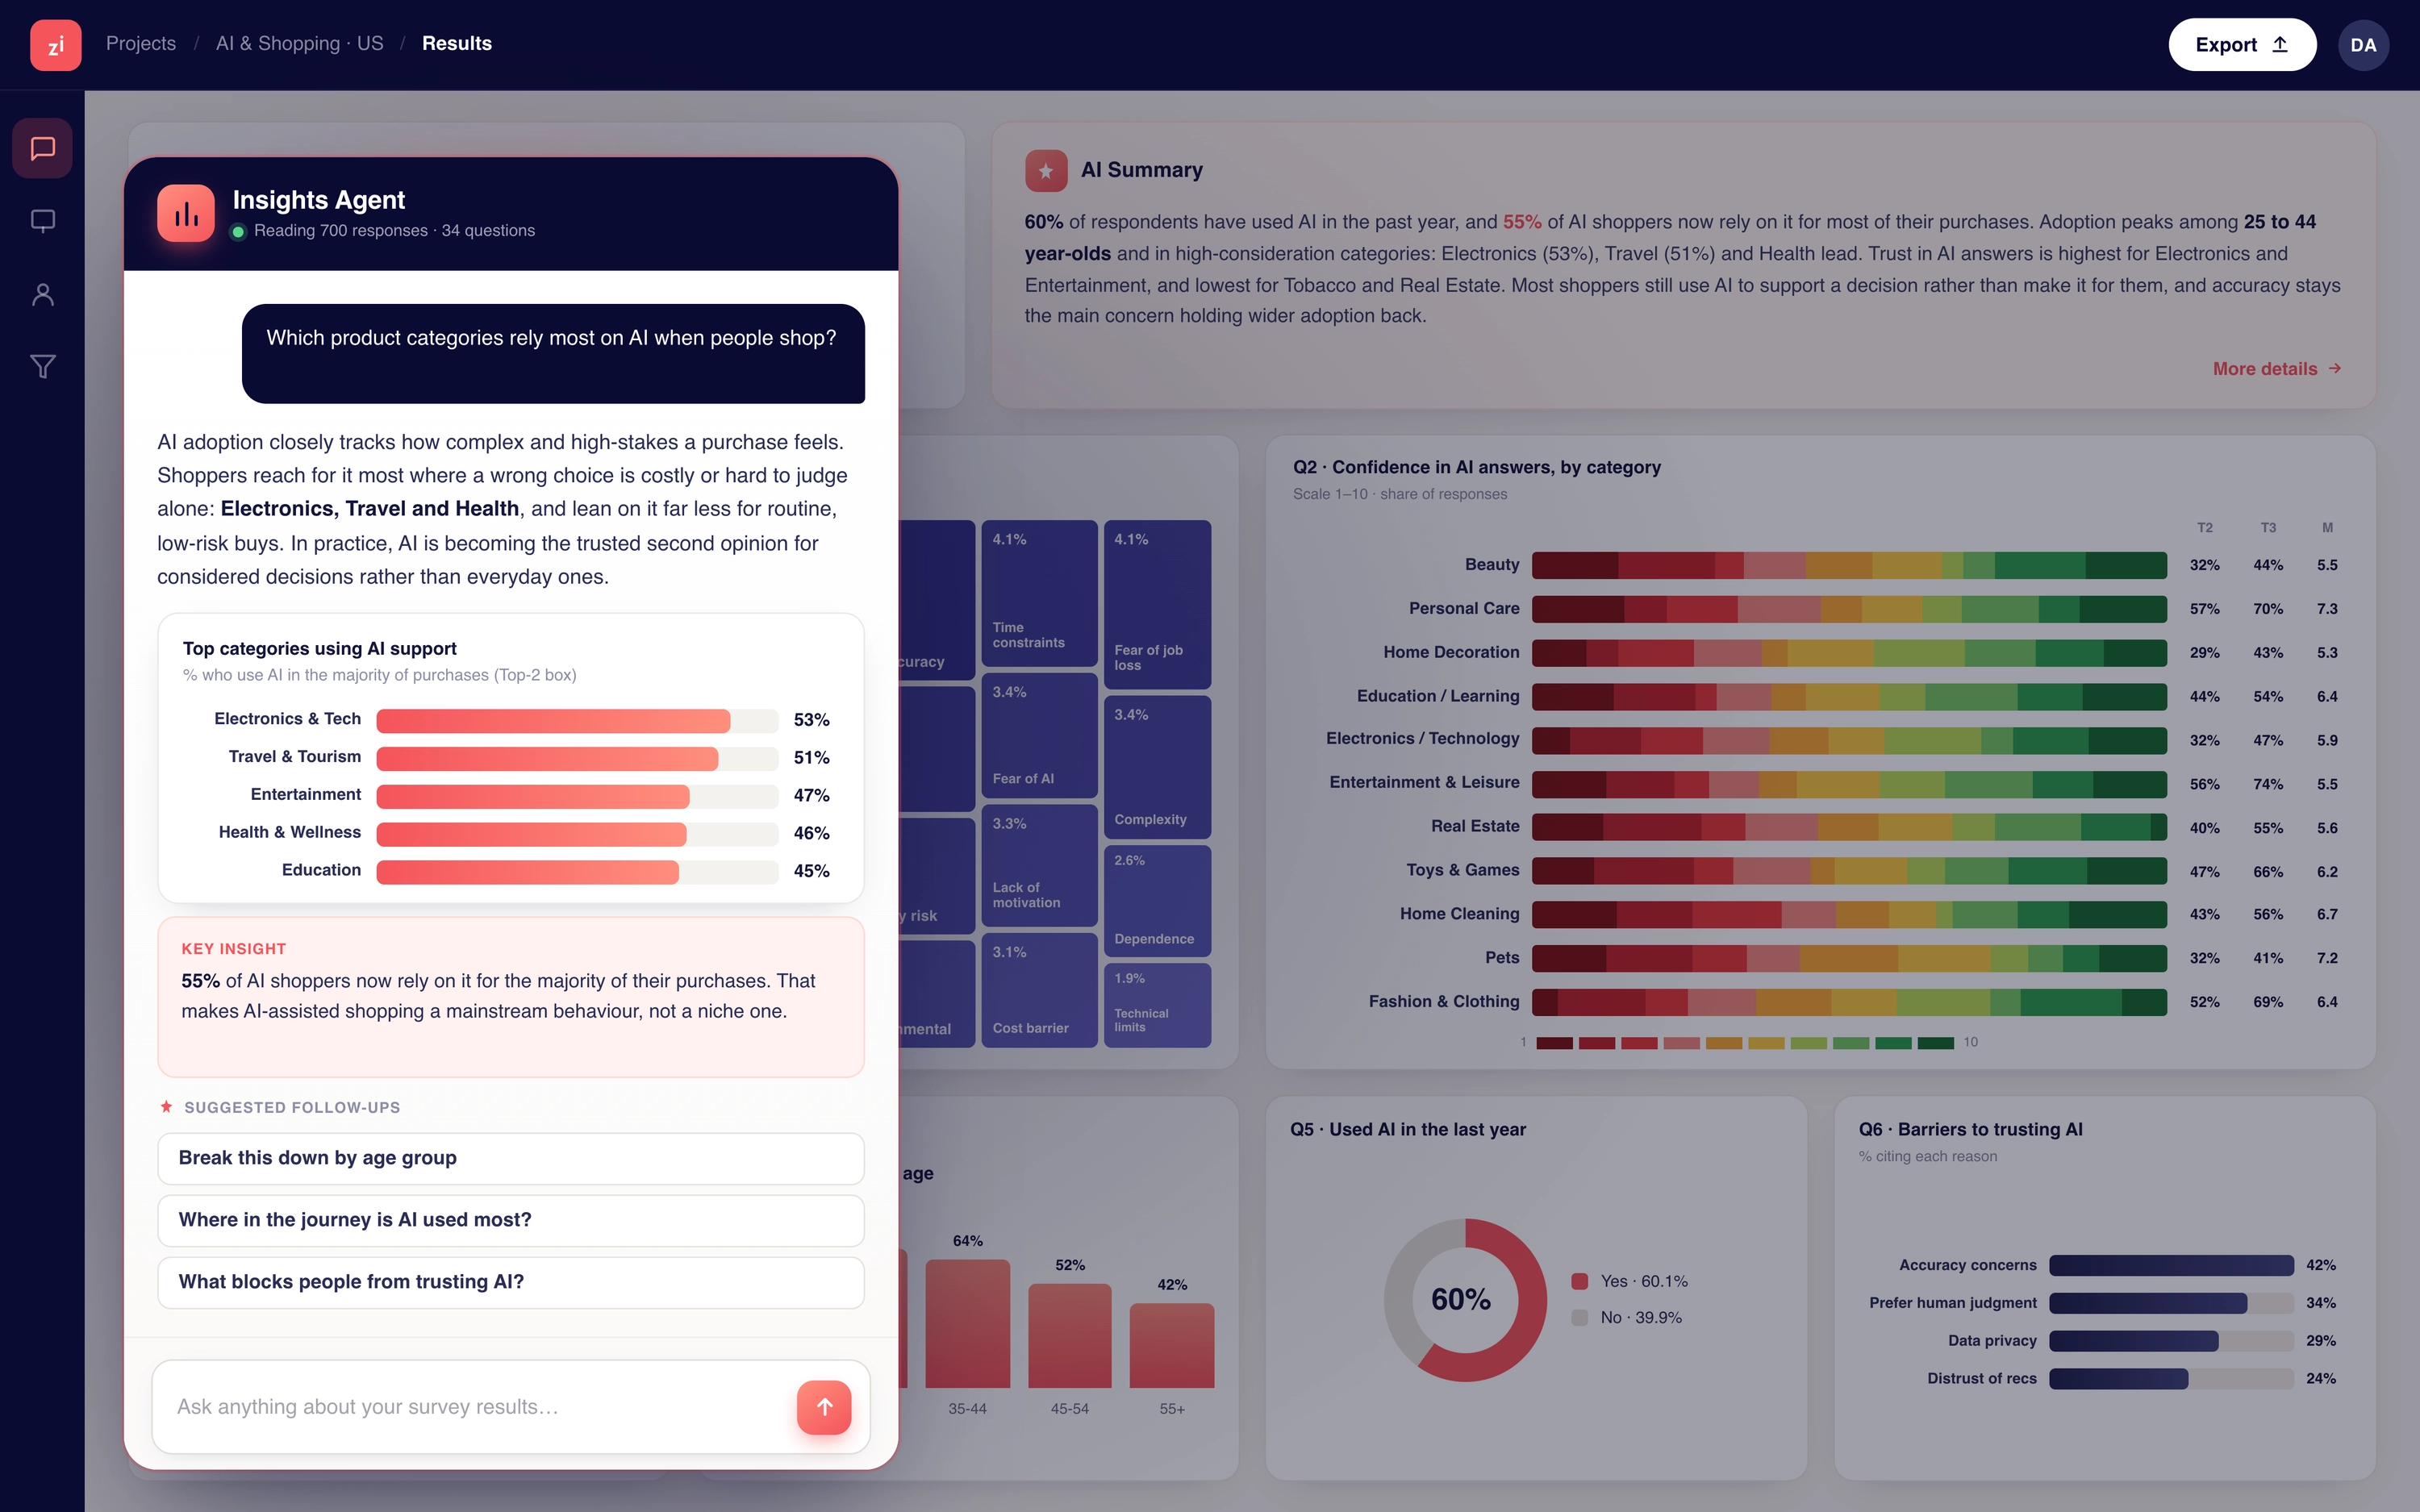
Brands grow by winning more buyers, and more buying moments.
Penetration and frequency are not two games. Both are won by owning more of the category's buying occasions: new buyers, and one more moment for the buyers you already have.
A tracker that only reports share hands you the score after the game. To grow, you have to see those moments move, and act while the quarter is still open.

Knowing the law of growth is not the same as running it.
A quarterly rear-view mirror
- A number arrives eight weeks late
- It tells you what happened, not what to do
- It lives in a gatekept PDF
- So it changes almost nothing
A system you manage from
- The read is live and continuous
- It names the constraint and the fix
- The whole team can ask it anything
- So the next decision is better
A scorecard reports the past. Managing the brand happens in the present.
Stop running a tracking exercise. Start running a brand management system.
Where are you today?
I already track, and we lead.
Turn the tracker you have into the system you manage the brand with.
Show meI track, but it never tells me what to do.
Consolidate the tracker and the ad-hoc studies into one read that names the move.
Show meWe lead on instinct and sales data.
Get leading indicators on the brand, not just lagging sales.
Show meWe move fast and skip the corporate theatre.
Find the next occasion you can win, for less than a media flight.
Show mePick the one that sounds like you. We will show you the version of this built for your situation.
Everything you already track. Then the part that makes it actionable.
Your growth, measured
Penetration, frequency and buyer tiers, the raw arithmetic of how a brand actually grows. Rooted in the Ehrenberg-Bass tradition, where growth comes from acquiring more buyers, not from deepening loyalty.
Where growth comes from
The category entry points, the cues and occasions that trigger a purchase, and how many your brand is linked to. From Romaniuk's work at Ehrenberg-Bass: you grow by coming to mind in more buying situations.
Top of mind
Mental availability, how readily the brand comes to mind at the moment of choice. Byron Sharp's slow-compounding asset, read through spontaneous retrieval, Kahneman's System 1, not prompted recognition.
Easy to buy
Physical availability, how easy the brand is to find and buy when the occasion strikes. The other half of Sharp's growth model, where presence in the market beats stated preference.
Where you leak buyers
The brand funnel, stage by stage, showing where buyers are won and where they drop out. The Kotler, Keller and Aaker conversion tradition every tracker is built on, kept because it still pinpoints where demand leaks.
What you stand for
Brand image and the attributes you own versus rivals. The Keller and Aaker brand-equity tradition: a brand is the associations that drive choice, so own the ones that matter.
Is your media working
Whether advertising and channels are actually moving the brand, balancing short-term activation with long-term brand building. Grounded in Binet and Field's effectiveness research and their 60/40 rule.
Ready for AI-led choice
How ready the brand is for AI-mediated and agentic buying in the category. An early read informed by Puntoni's work on how algorithms are reshaping consumer choice.
All eight reads compute the integrated index, the whole picture in one number, across every school of brand growth.
Complete
Eight reads across five schools of brand growth, on one sample. Not a funnel you watch.
Actionable
Every read comes as a decision: what it reveals, what to do, and why it matters for growth.
Continuous
It refreshes wave over wave, so managing the brand becomes a rhythm, not an annual event.
Deep on demand
When the tracker does not carry the question, launch the study that does, on the same platform, and have the answer in days.
Five schools of brand growth. One integrated read.
Sharp and Romaniuk, Kotler-Keller-Aaker, Kahneman, Binet and Puntoni, across eight modules and one sample. The AI plans and explains; a deterministic engine computes, so it never invents a number.
All eight modules compute the score. Click any component to open it; each is also a read you can act on in its own right.
The engine computes every number from the same sample. The analyst explains it; it never invents it.
Feeds the index
Growth measured
18.8%
Penetration, frequency and buyer tiers, the raw arithmetic of how you actually grow.
What to do
Grow penetration first. One more buyer is worth more than one more purchase from a current buyer.
Ask the question. The answer comes from your data, not a model.
Ask it anything between waves. It names the constraining parameter, quantifies the fix, and ranks your next move. A deterministic engine does the maths, so it never invents a number.
TRY THE ANALYST
Why did my Favourite-Brand score slip?
Manage the brand wave over wave, do not just monitor it.
A signal moves, the analyst prescribes, the next wave measures whether it worked. That loop is the difference between a report and a management system.
Baseline
Wave one sets the record.
You lead every funnel stage, but Favourite Brand slips behind private label, 18.8% to 21.3%.
When the tracker can't answer, launch the study that can.
It runs on the Zinklar platform. Every tracker eventually hits a question it was not set up for: a new competitor, a surprise in the data, a decision no one saw coming last quarter.
Here you do not wait for the next wave. Launch a full study the same day, to the same kind of real respondents, and fold the answer back into the same continuous read.
You are never one question away from being stuck.
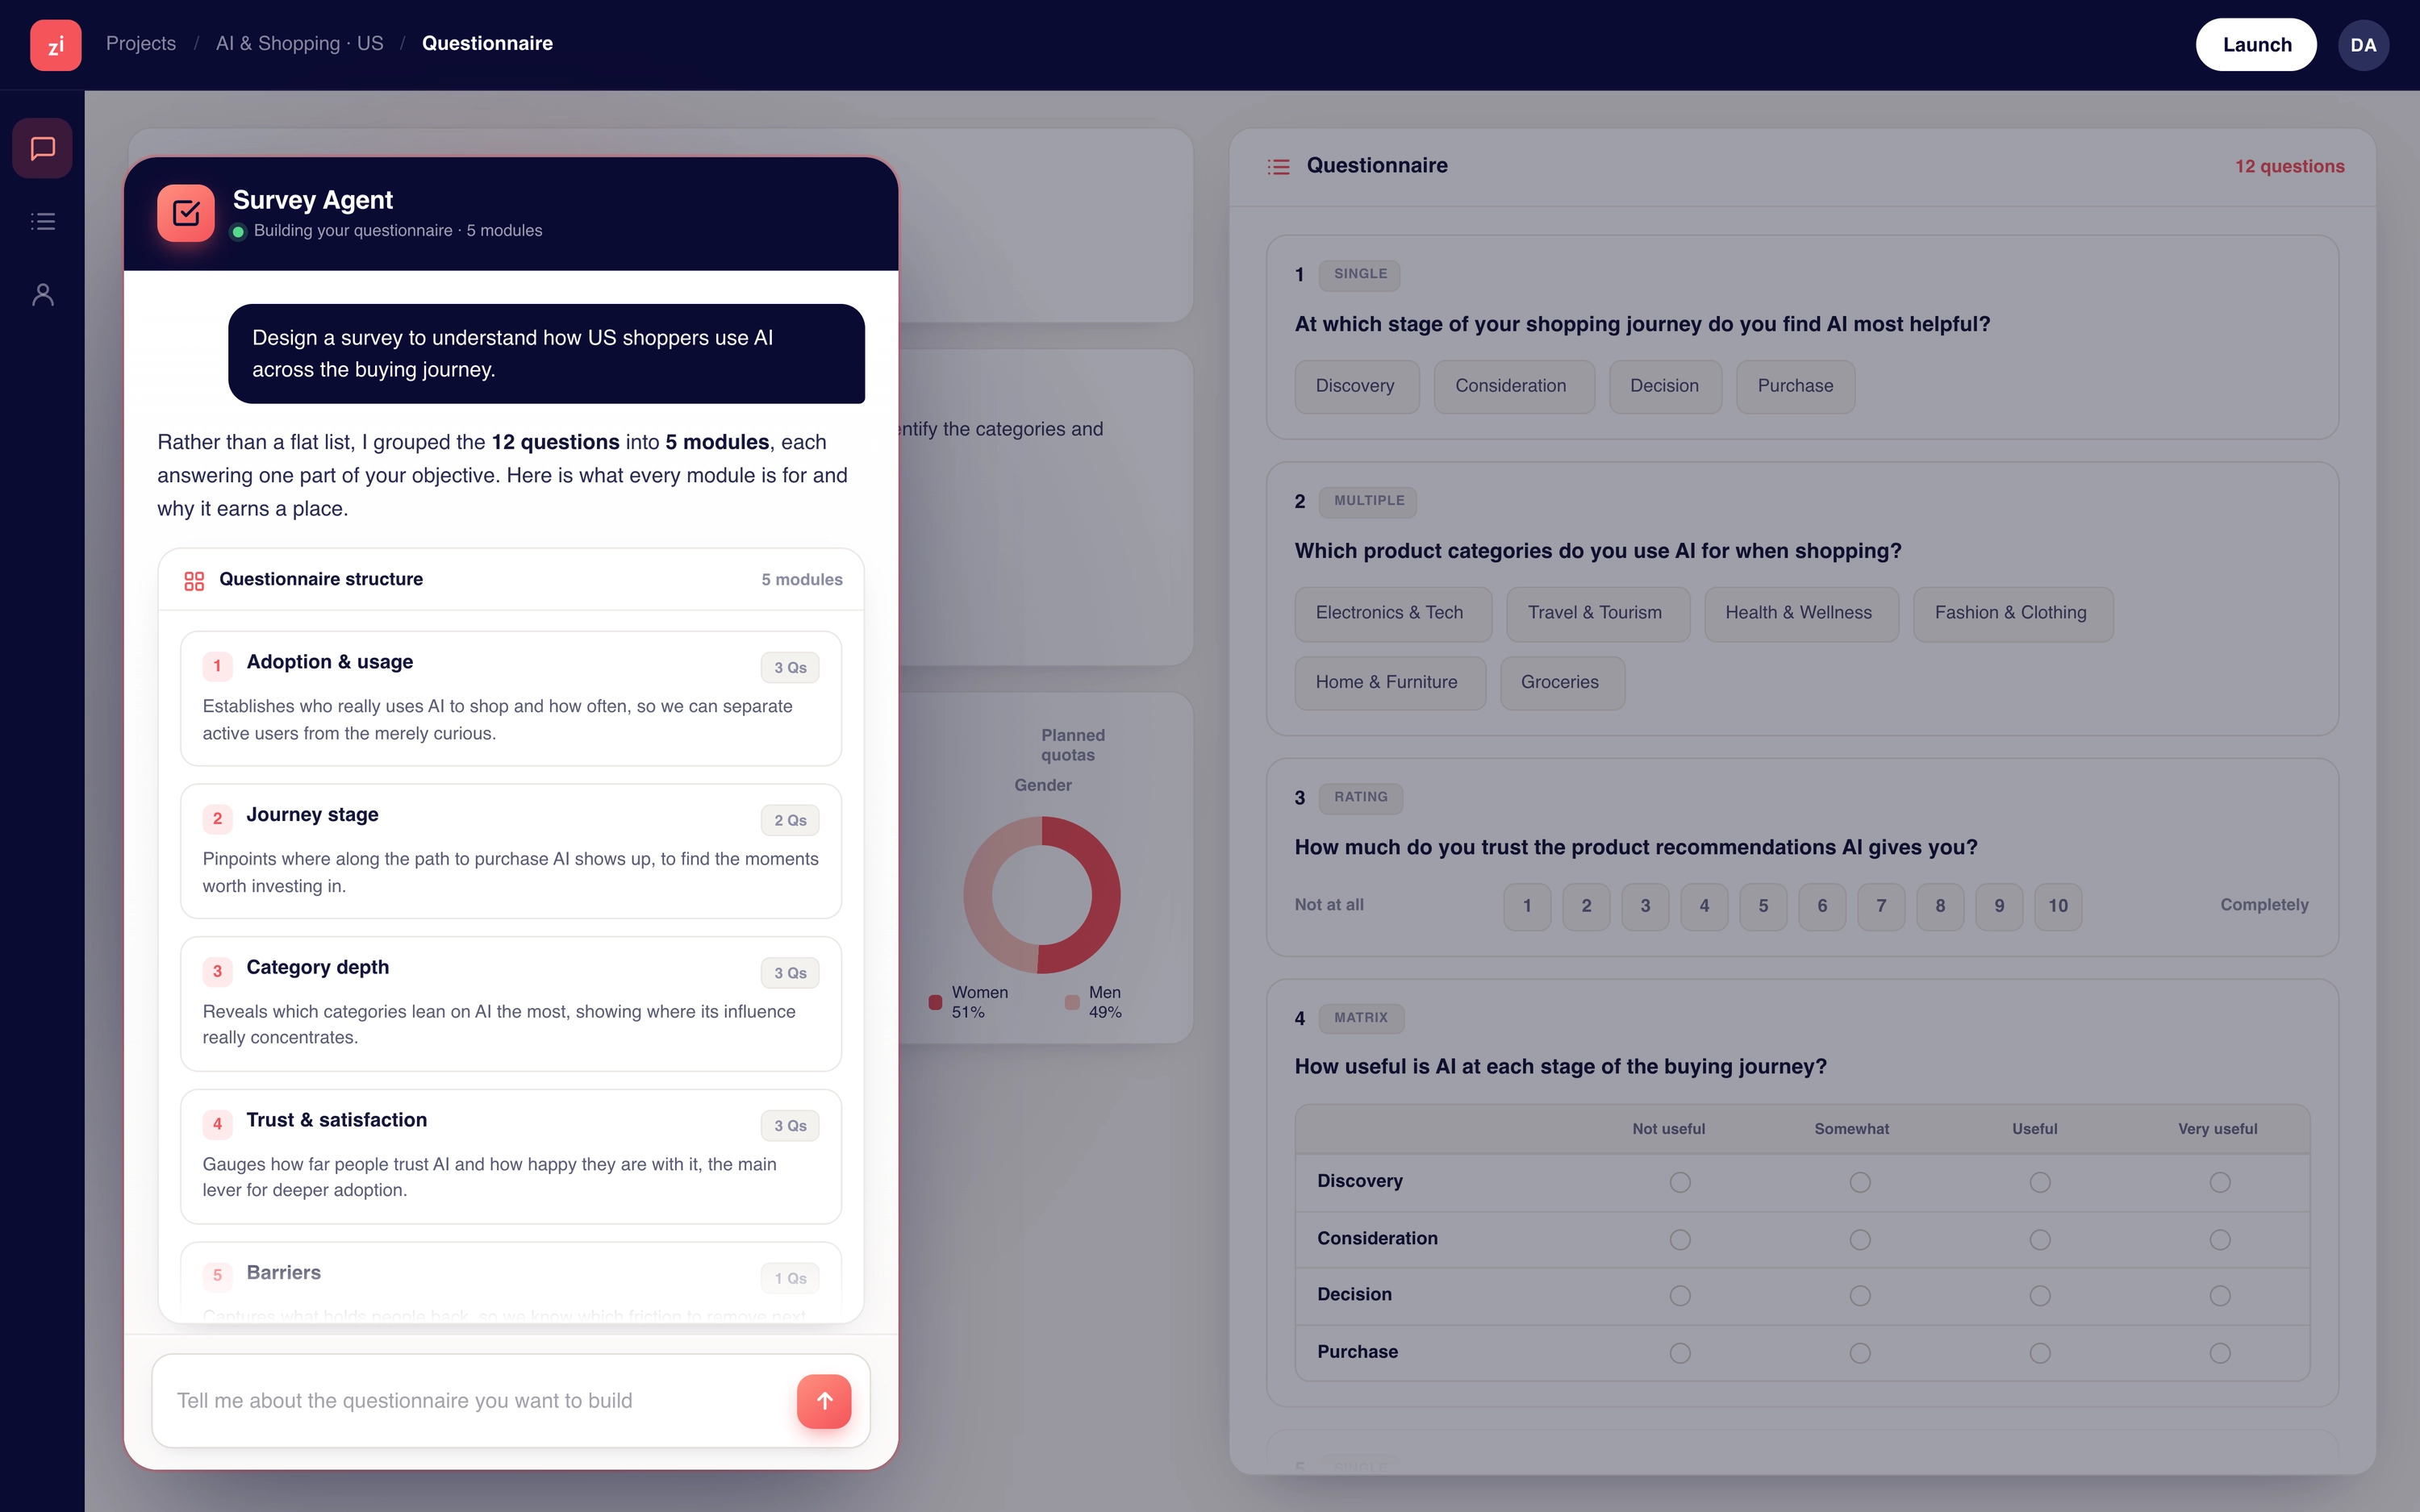
One system, read two ways.
For marketing
Marketing grows the brand.
See which occasions to own and which distinctive assets win preference, then put the next flight where it compounds.
For insights
Insights leads the strategy.
Bring a defensible read to every planning conversation, and answer the follow-up in the room, not in three weeks.
A number that tells you the truth, and what to do about it.
An honest read, not a flattering one: in one real category the index is 0.79, because a private label quietly overtakes the leader at Favourite Brand. It shows the weak spot, not a pretty picture.
R-squared: the index tracks category penetration.
Spearman rho: share of index matches stated purchase share.
where the leader quietly loses Favourite Brand (vs 18.8%).
of buyers name no brand for two orphaned occasions.
LET'S TALK
Put a date on wave one.
Book a demo and bring the brand you are managing. We'll show you the first wave, live, on your category.